NagarMatrix Ventures Pvt Ltd | Urban geospatial services & municipal software
+91 95023 53944|info@nagarmatrix.com
Home/Services

Services

Ten disciplines covering field survey, subsurface investigation, hydrological study, spatial analysis, statutory planning and 3D city modelling. Every assignment is quoted against a written accuracy standard and a defined deliverable set.

Survey & data acquisition

Measured ground truth — instrument-based capture tied to GNSS control, with an independent check-point report on every dataset.

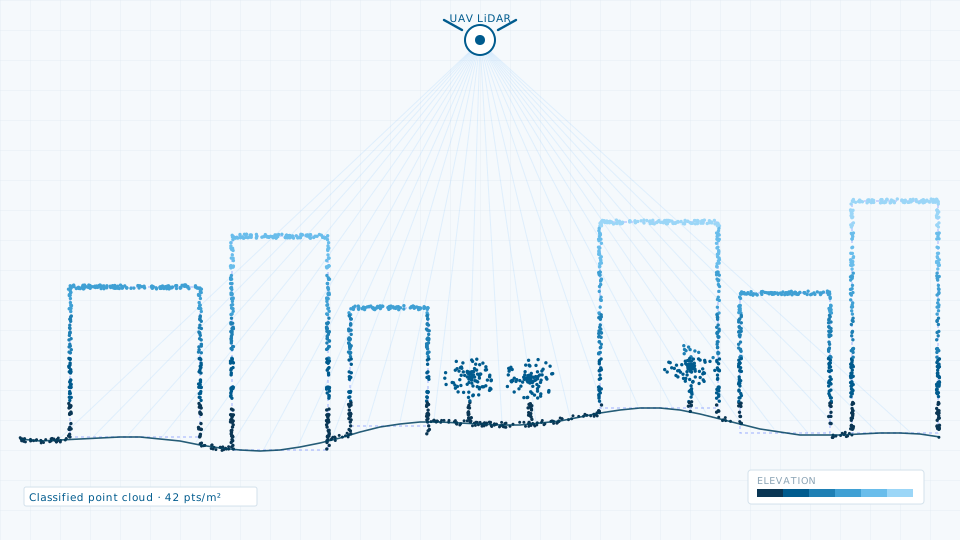
LiDAR Survey — illustration of a typical deliverable

LiDAR Survey

Terrestrial, mobile and UAV LiDAR for corridors, city blocks and asset inventories.

Point density
8–100 points per square metre, set by platform and flying height
Vertical accuracy
±3–5 cm against independent check points
Horizontal accuracy
±5–8 cm, GNSS/CORS-tied
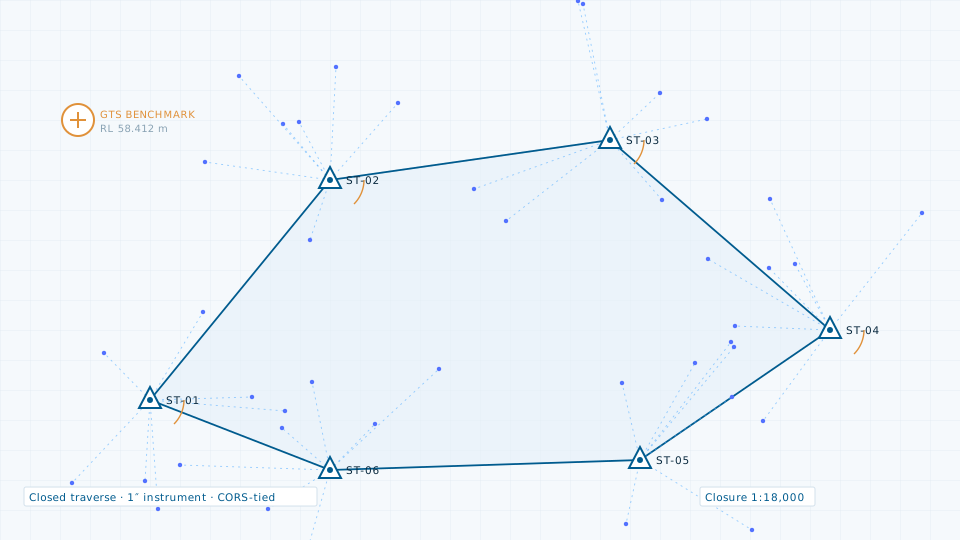
Total Station Survey — illustration of a typical deliverable

Total Station Survey

Control network establishment and detailed topographic pickup for DPR-grade drawings.

Instruments
1″ to 2″ angular accuracy total stations; dual-frequency GNSS receivers
Control
DGNSS and CORS-tied, referenced to GTS benchmarks where available
Drawing scale
1:500 to 1:2000, or as specified
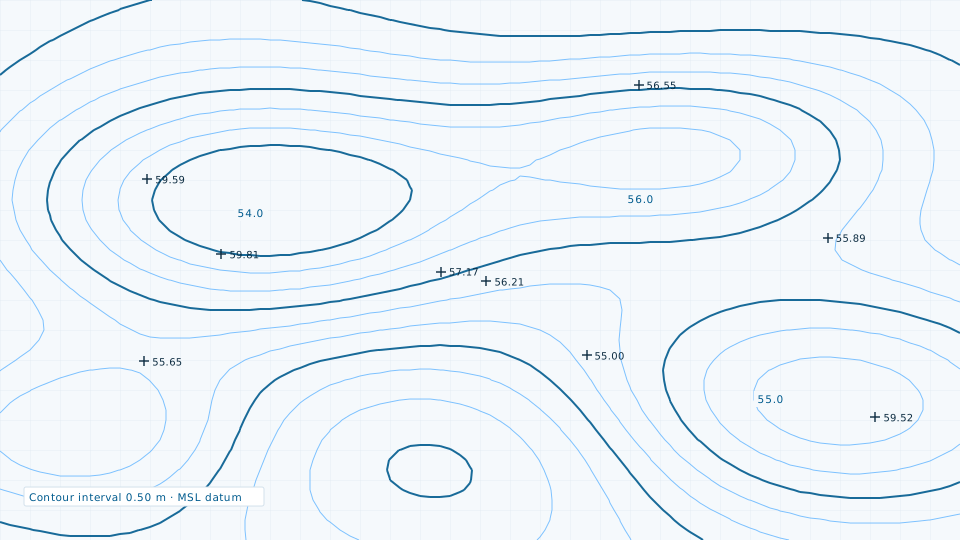
Contour Survey — illustration of a typical deliverable

Contour Survey

Contour generation at engineering intervals for drainage, road profiling and earthwork.

Contour interval
0.25 m, 0.5 m or 1.0 m
Source data
LiDAR, UAV photogrammetry or total station, as suits the site
Vertical datum
Mean sea level, tied to GTS benchmark where available
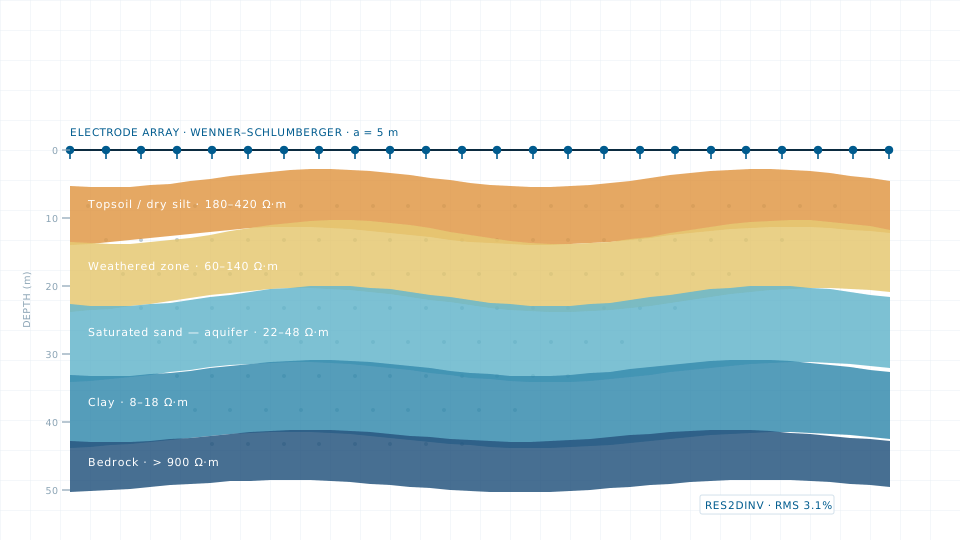
Electrical Resistivity Survey — illustration of a typical deliverable

Electrical Resistivity Survey

VES and 2D imaging to resolve aquifer depth, bedrock profile and contamination zones.

Configurations
Schlumberger, Wenner, Wenner-Schlumberger, dipole–dipole
Investigation depth
To approximately 200 m, dependent on spread length and ground conditions
Inversion software
RES2DINV, IPI2Win

Studies & spatial analysis

Evidence for decisions — hydrological, subsurface and terrain analysis written up for DPRs, funding proposals and technical audits.

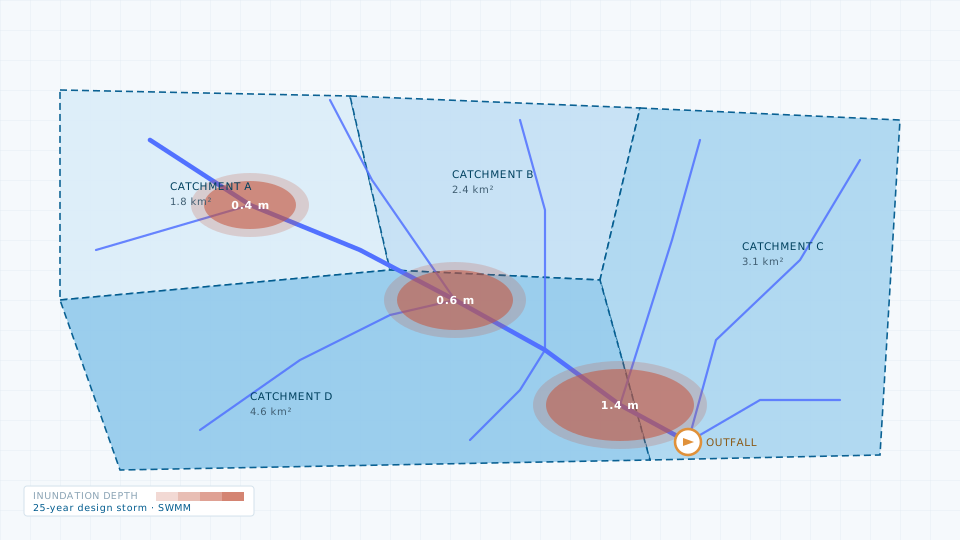
Drainage Study — illustration of a typical deliverable

Drainage Study

Catchment delineation, storm-water network modelling and flood risk mapping.

Modelling software
EPA SWMM, HEC-RAS
Terrain input
LiDAR or UAV-derived DEM, 0.5 m preferred
Rainfall input
IDF curves from IMD records for the station nearest the site
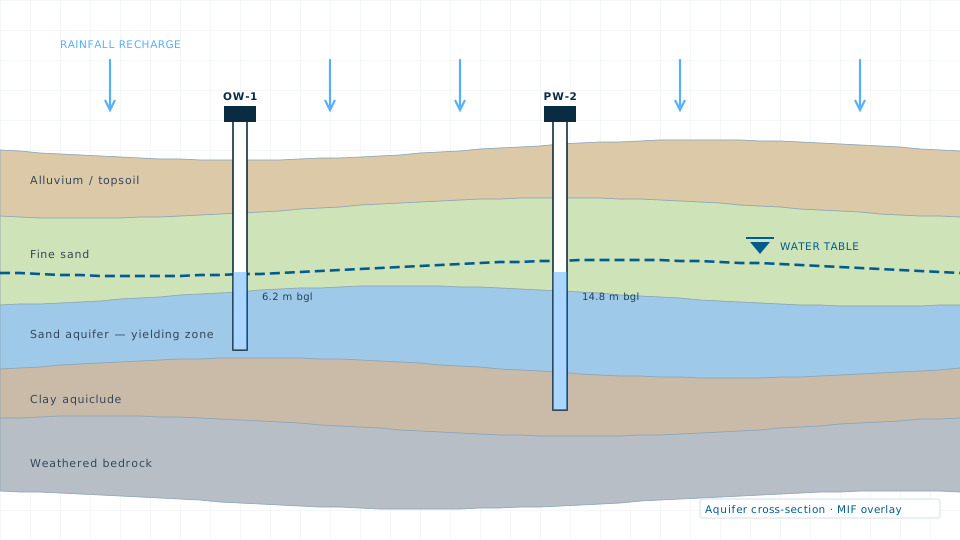
Groundwater Study — illustration of a typical deliverable

Groundwater Study

Aquifer characterisation, recharge potential mapping and water level trend analysis.

Analytical method
Multi-influencing factor and analytic hierarchy process overlay
Satellite analysis
Google Earth Engine time series on Sentinel and Landsat archives
Field input
Observation well levels, lithological logs, resistivity soundings
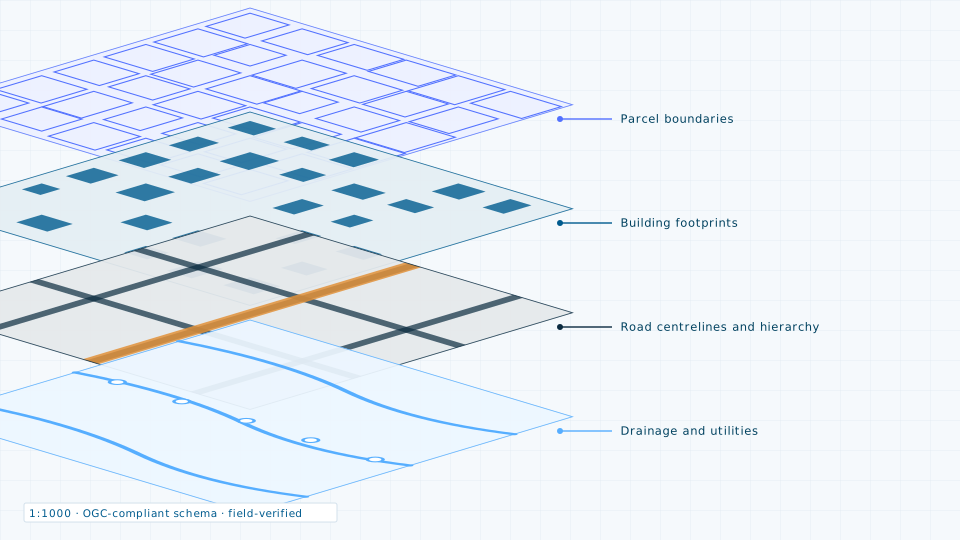
GIS Base Map Preparation — illustration of a typical deliverable

GIS Base Map Preparation

Ward-level base maps built from imagery and verified on the ground.

Mapping scale
1:1000 to 1:4000
Imagery source
Sub-metre satellite or UAV orthomosaic at 2–5 cm
Verification
Field survey of every ward, with a sample re-check for QA
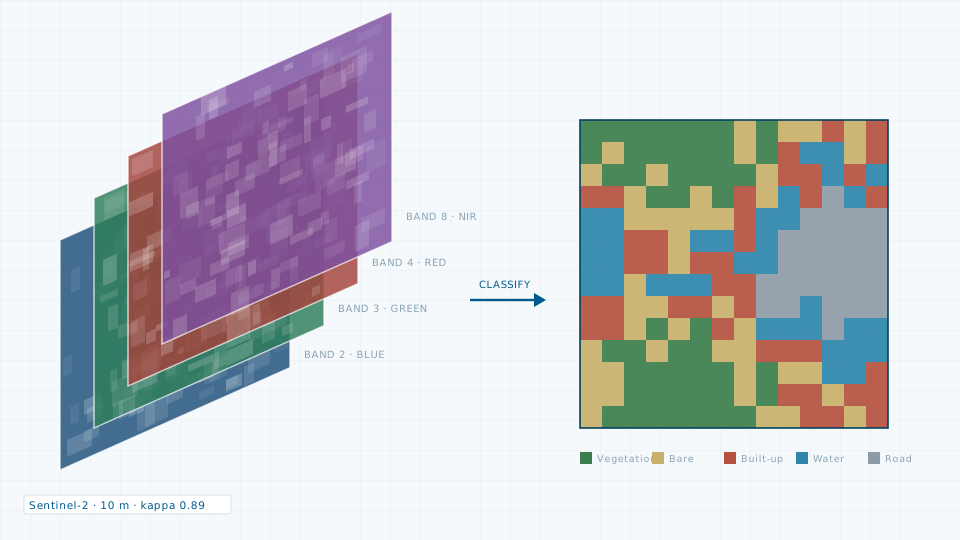
Remote Sensing Analysis — illustration of a typical deliverable

Remote Sensing Analysis

Land use classification, growth series, urban heat and change detection.

Imagery sources
Sentinel-2, Landsat, Cartosat, and commercial VHR where required
Classification
Supervised — random forest, SVM and maximum likelihood as appropriate
Accuracy reporting
Confusion matrix and kappa coefficient always reported

Planning & digital twin

From measured data to statutory output — plans that survive scrutiny, and 3D models a department can query rather than only look at.

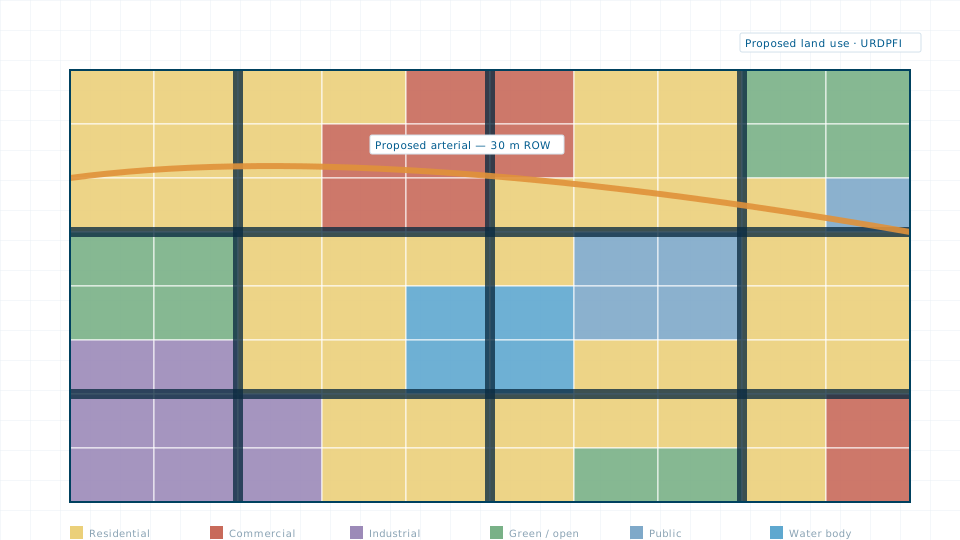
Urban Planning — illustration of a typical deliverable

Urban Planning

Master plans, land use plans, zoning schemes and Local Area Plans.

Frameworks
URDPFI guidelines, AMRUT 2.0, applicable state town planning acts and bye-laws
Base data
Field-verified GIS base map, satellite imagery, revenue records
Analysis
Suitability, density, growth projection, infrastructure gap
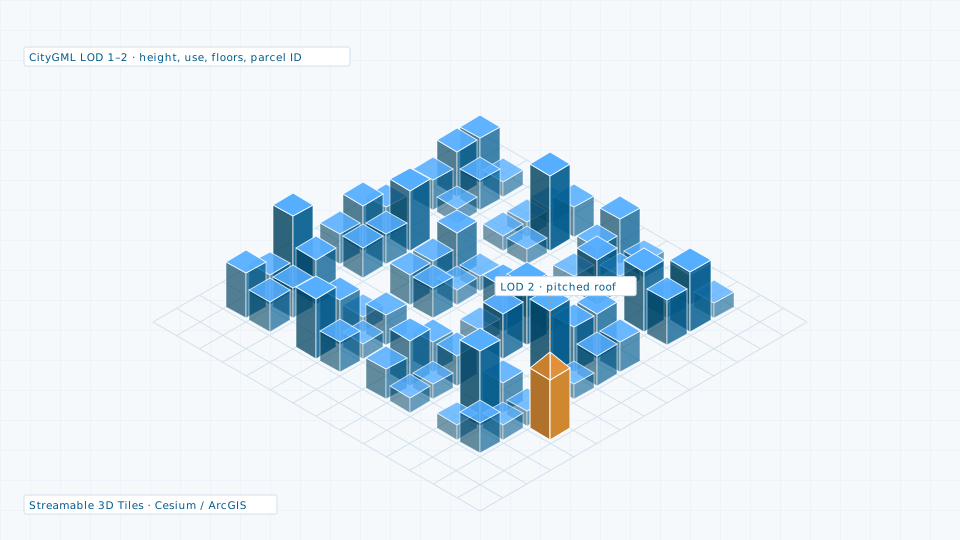
3D Modelling & Digital Twin City — illustration of a typical deliverable

3D Modelling & Digital Twin City

CityGML city models, textured meshes and streamable 3D Tiles.

Level of detail
CityGML LOD 1 and LOD 2 standard; LOD 3 for selected structures
Geometry source
Classified LiDAR point cloud and UAV photogrammetry
Texturing
UAV oblique imagery, façade-mapped

Not sure which service fits your requirement?

Tell us the problem rather than the method. We will propose the survey or study that answers it.